
What it does
Website Monitor watches the sites you care about and tells you the moment something needs you. Nothing to install, nothing to host. You paste a URL and we do the rest from our servers.
There are two halves to what we watch. The first is whether your site is working: is it up, is the SSL certificate current, is the domain registration safe. The second is whether it is still right for search: are your titles, canonicals, indexability, structured data, and tracking tags intact, or did a deploy quietly change them. An uptime monitor only covers the first half. We cover both.
Alerts arrive by email and browser push, and you can route them to Slack or your own webhook. The rest of this guide walks through each piece in the order you would meet it.
Signing in
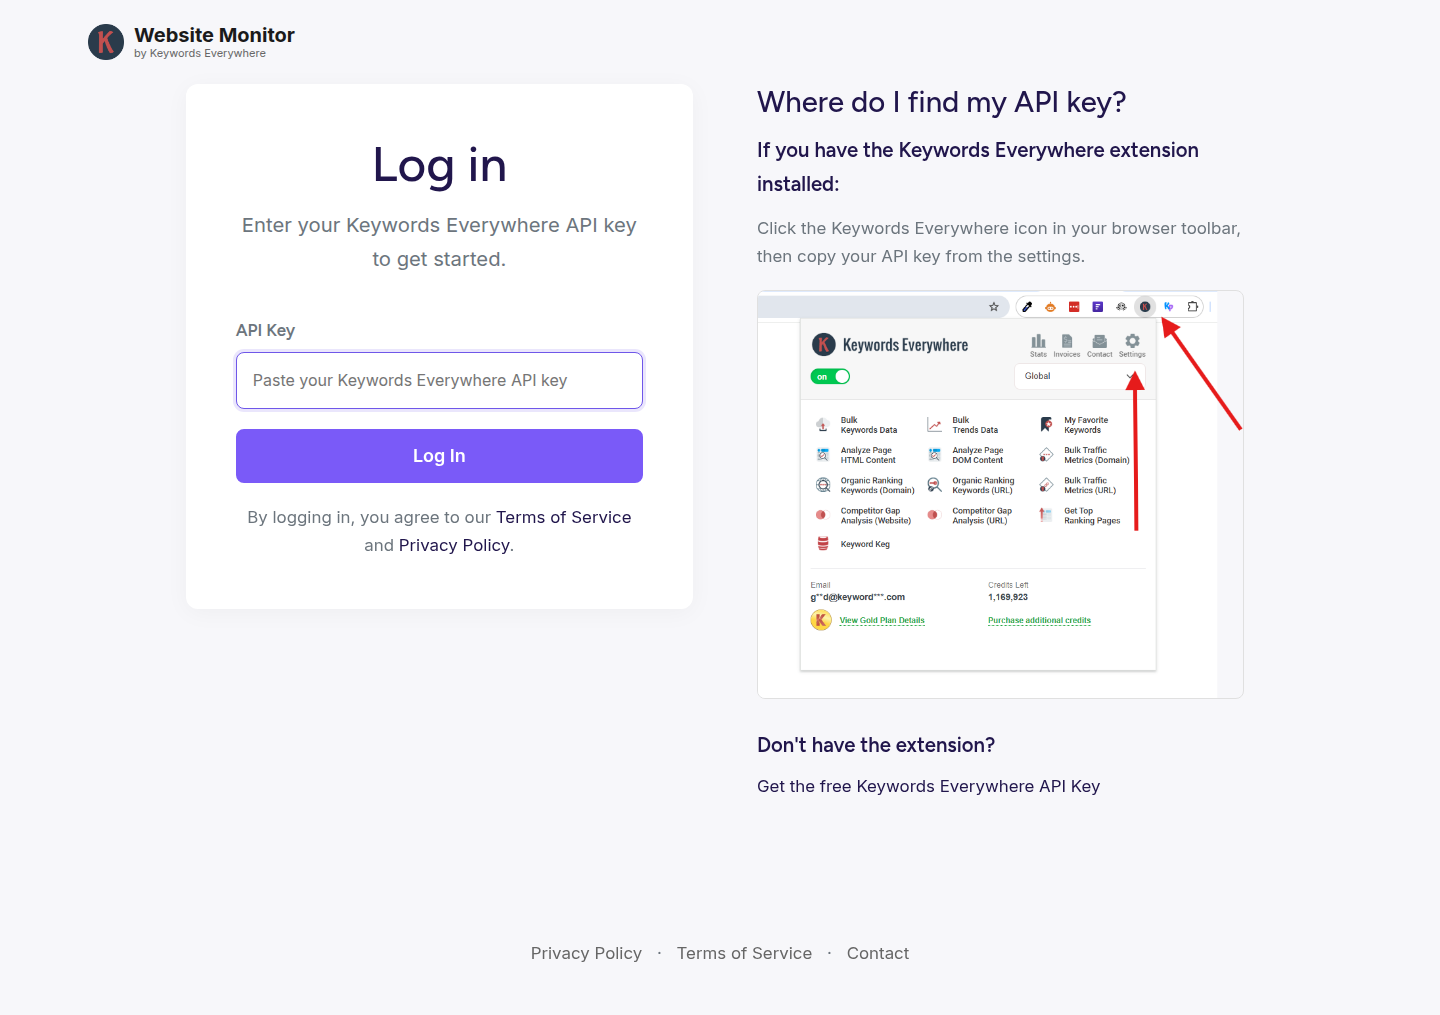
Website Monitor is free for everyone with a Keywords Everywhere account, and you log in with your Keywords Everywhere API key. There is no separate password to create.
Paste your API key and click Log In. If you have the Keywords Everywhere browser extension, your key is in the extension settings. If you do not, the help panel links you to a free key. We create your workspace automatically on first login, so you land straight on an empty dashboard ready for your first monitor.
The dashboard
The dashboard is the one screen that answers "is everything okay?" Every monitor you own is in one list. A green Up means it is working, a red Down means it needs you, and Checking means we have not completed the first check yet.
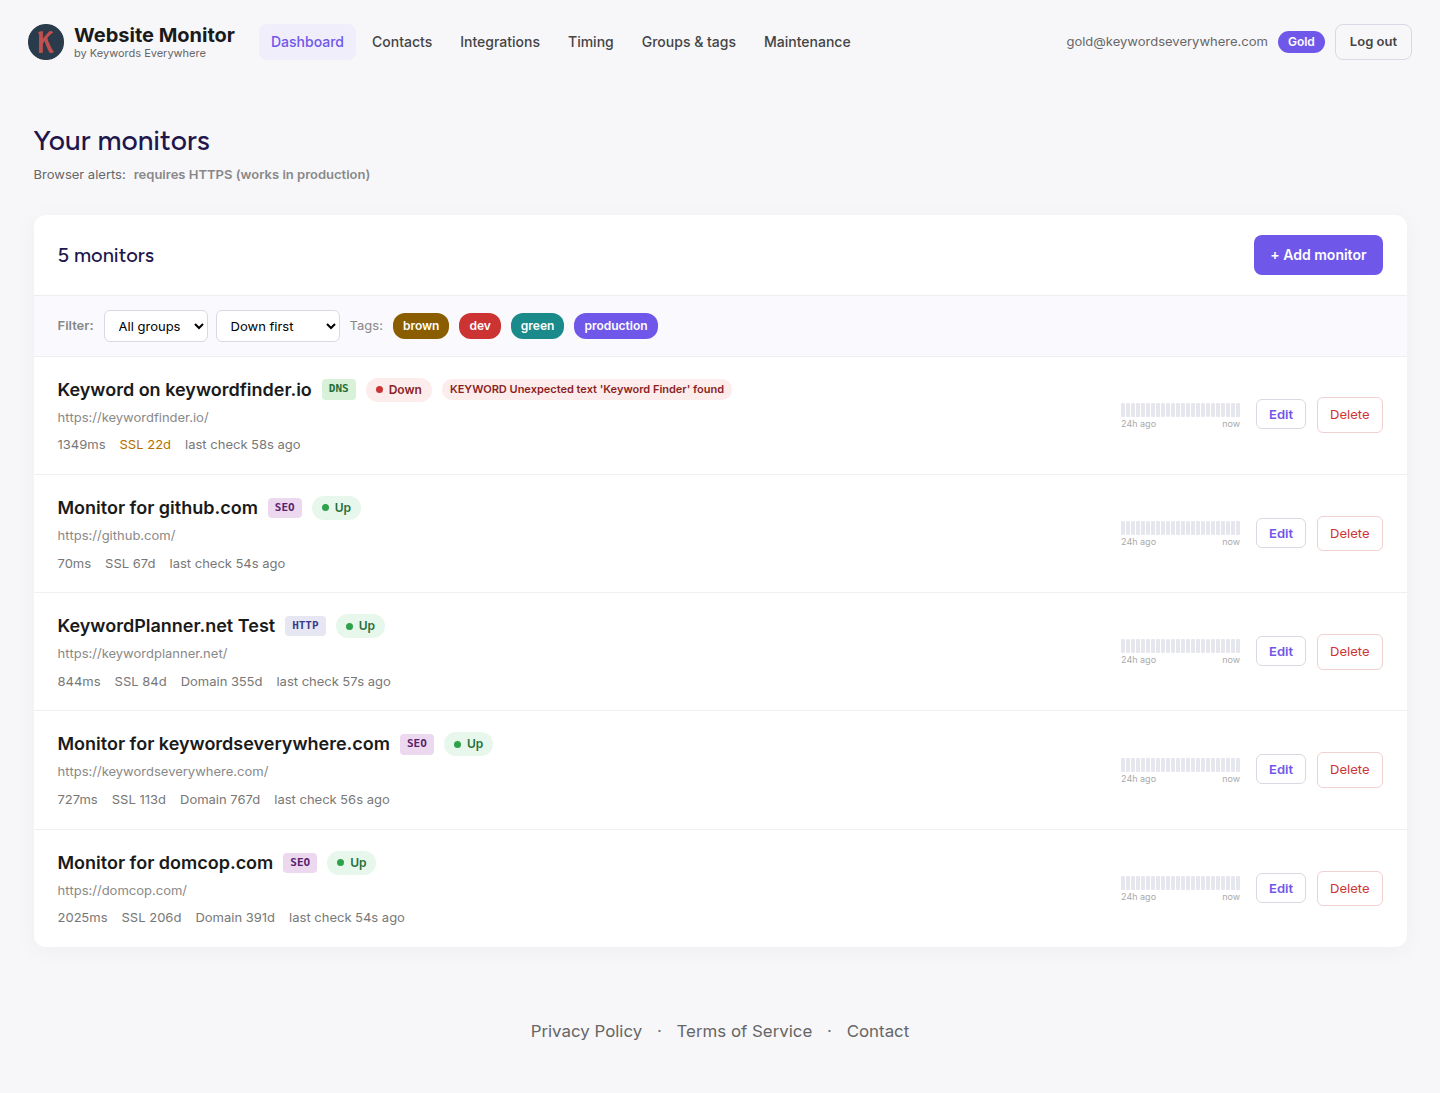
Each row tells you a lot at a glance:
- Type badge (HTTP, KW, DNS, SEO) shows which kind of check leads on that monitor.
- Status and, when something is wrong, a root-cause chip that names the problem, for example
KEYWORD Unexpected text foundor500 Internal Server Error. - Metrics: last response time, days until the SSL certificate expires, days until the domain expires, and when we last checked.
- 24-hour uptime bar, one small bar per hour, so you can spot a rough patch even when the site is up now. The bars fill in as checks accumulate.
At the top, Filter by group, Sort (Down-first, Newest, Name, or Last-checked), and click a tag chip to show only monitors with that tag. The + Add monitor button is always one click away.
Adding a monitor
Click + Add monitor. The only required field is the URL. Paste a web address and we start watching it within seconds. Everything else is optional and has a sensible default.
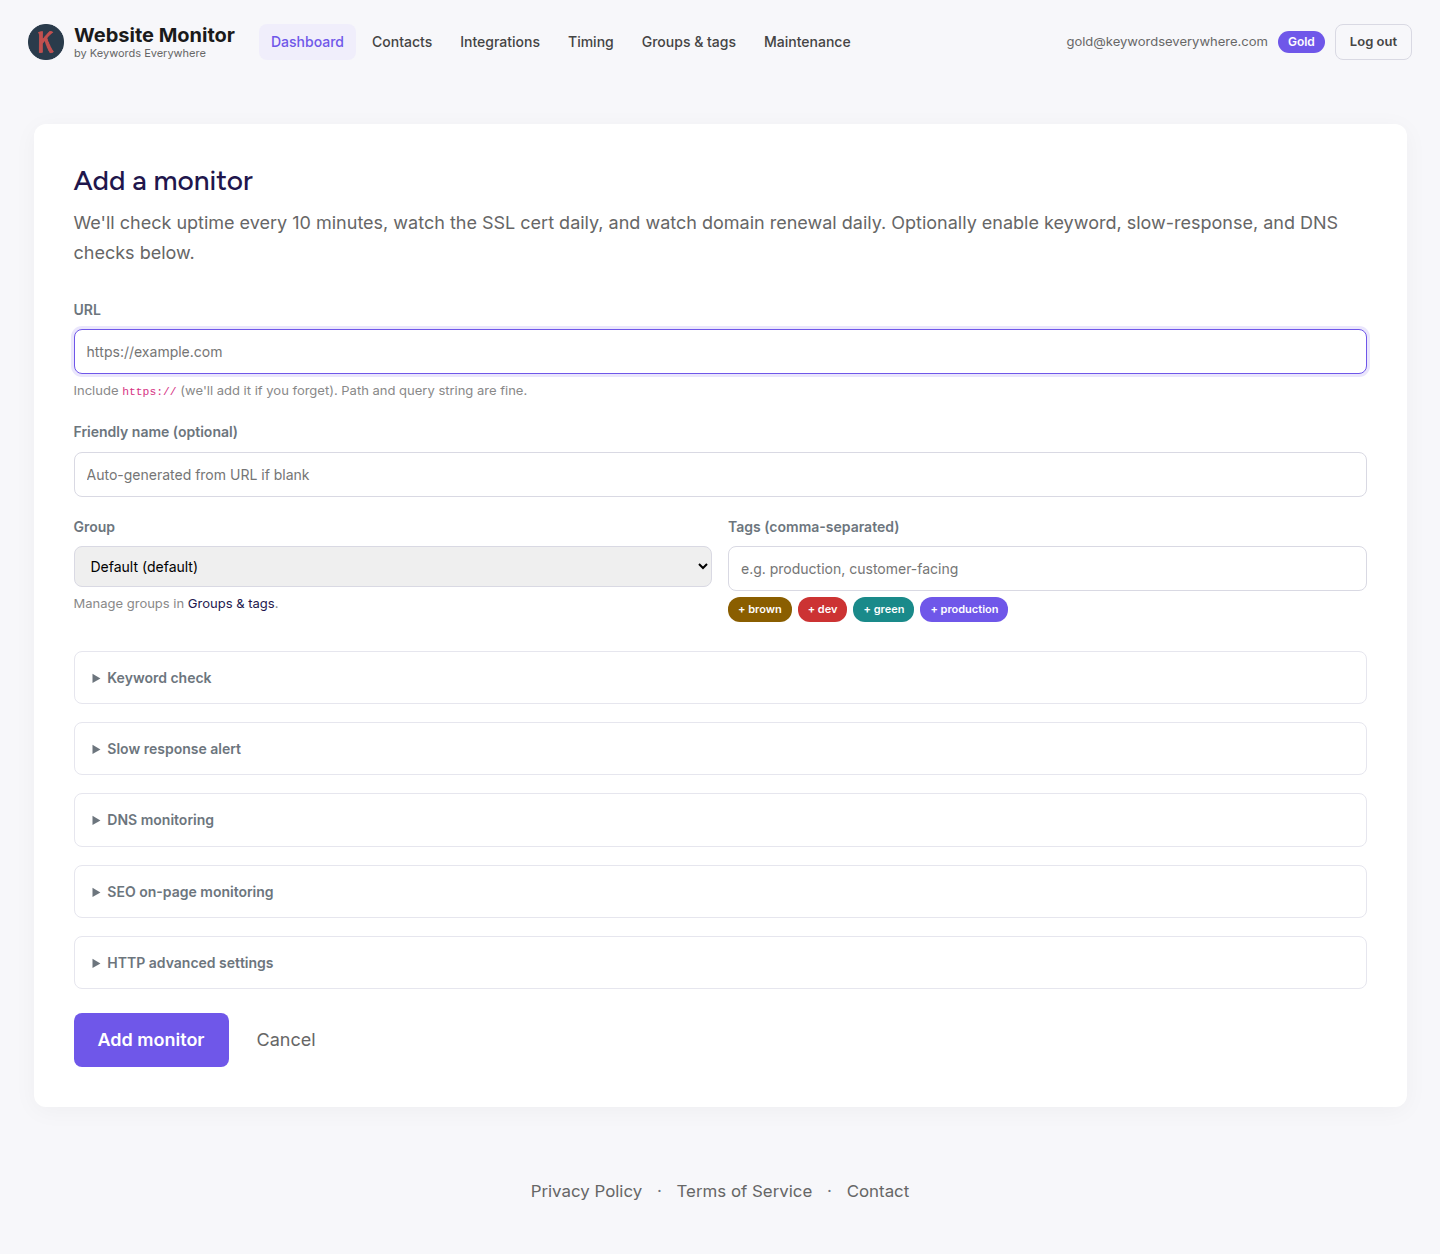
- URL: include
https://(we add it if you forget). A path and query string are fine. - Friendly name: optional. If you leave it blank we use the domain (e.g. "example.com", or "example.com (Out of stock)" for a keyword check).
- Group: each monitor lives in exactly one group, which buckets the dashboard.
- Tags: free-form labels for filtering. Type comma-separated names or click a recent tag to add it.
Below those, each optional check has its own section. Uptime, SSL, and domain monitoring are always on, so they need no setup. The expandable sections add keyword, slow-response, DNS, and SEO checks, plus advanced HTTP options.
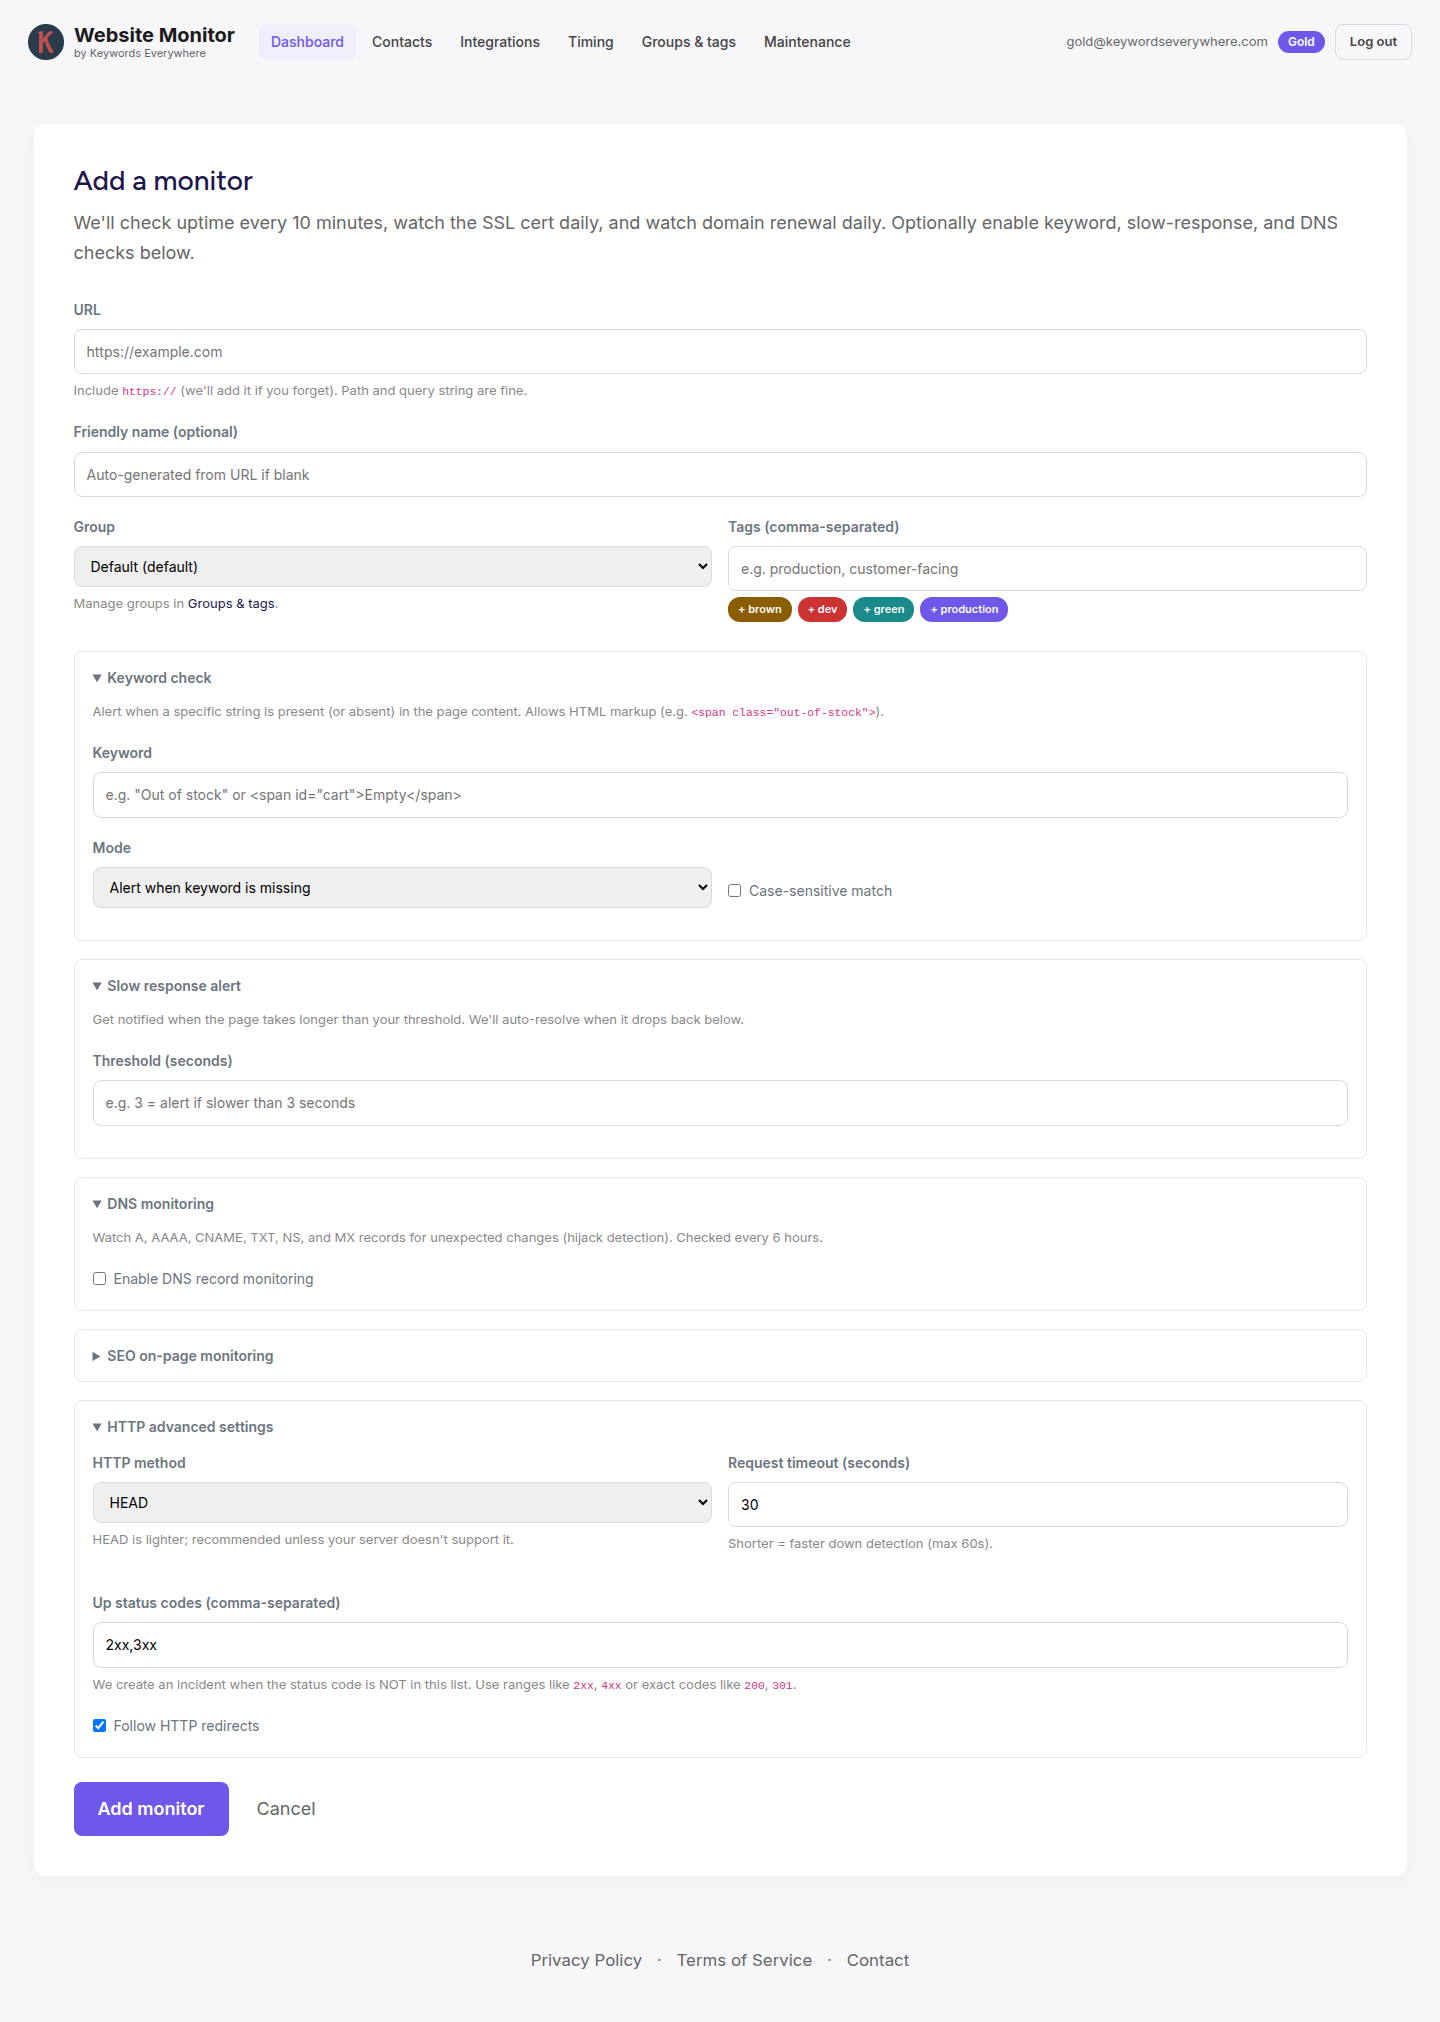
The HTTP advanced settings let you choose the request method (HEAD by default, which is fast and light), set a request timeout, list which status codes count as "up" (for example 2xx and 3xx, or an exact code), and decide whether to follow redirects. Most sites never need to touch these.
Uptime & response time
We request your URL every 10 minutes, the way a visitor would, and watch for a healthy response. A 2xx or 3xx status is "up". A 4xx, a 5xx, a timeout, a DNS failure, or a TLS handshake failure is "down".
To avoid crying wolf over a one-second network blip, we confirm a problem with two failed checks in a row before we open an incident and alert you. Recovery is symmetric: we wait for two successful checks before we close the incident and send the all-clear. That keeps a flapping site from spamming your inbox.
Every uptime check also measures how long the site took to respond and breaks it into DNS, connect, TLS, and time-to-first-byte. We chart response time on the monitor page so you can see a site getting slower before it actually breaks.
SSL certificate monitoring
An expired certificate turns the browser into a full-screen security warning, and visitors leave. We check your certificate once a day and warn you well ahead: 30, 14, 7, and 1 day before it expires.
Each check reads what your live URL actually serves, so it works the same for Let's Encrypt, Cloudflare, and commercial certificates. We record the issuer, the subject, the expiry date, whether the chain is valid, and whether the hostname matches. SSL checks are shared per host, so two monitors on the same host do not double the work.
Domain expiry monitoring
Domain renewals slip through the cracks. They are billed once a year, often to an old card or a forgotten inbox, and a lapsed domain can take your whole site offline. We watch the registration record once a day and warn you 60, 30, 14, and 7 days before it expires.
We use RDAP where it is available and fall back to WHOIS, and we record the registrar, the registration and expiry dates, and the nameservers. Like SSL, domain checks are shared across every monitor on the same domain.
Keyword & slow-response checks
These two checks piggyback on the uptime request, so they cost nothing extra and run on the same 10-minute cadence.
Keyword check
Tell us a word or phrase that should (or should not) be on the page. The common case is "make sure this text stays here", so the default is Alert when the keyword is missing, useful for catching a checkout button that vanished or a price block that failed to render. Flip it to Alert when the keyword is present to catch the opposite, like the word "error" or a staging banner showing up in production. You can make the match case-sensitive.
Slow-response alert
Set a threshold in seconds. If a response takes longer than that, we raise a slow-response incident even though the site is technically up. It is an early warning that something is degrading.
DNS record monitoring
Turn on DNS monitoring and we watch your records (A, AAAA, CNAME, TXT, NS, MX) for changes. We do not ask you to type in expected values. We snapshot what resolves today and alert you when it changes, which catches hijacks, accidental edits, and propagation surprises. Records are canonicalized before comparison so a harmless reordering by your resolver does not look like a change.
SEO on-page monitoring
This is the part a plain uptime monitor cannot do. A page can return a perfect 200 and still be quietly falling out of Google because a deploy changed something on it. SEO monitoring re-reads each page on a schedule and tells you when a signal that matters to search changes.
Enable it in the SEO section of the add or edit form, choose a cadence (every hour, every 6 hours, every 12 hours, or daily, every 12 hours is the default), and optionally point us at your sitemap and your nav and footer selectors.
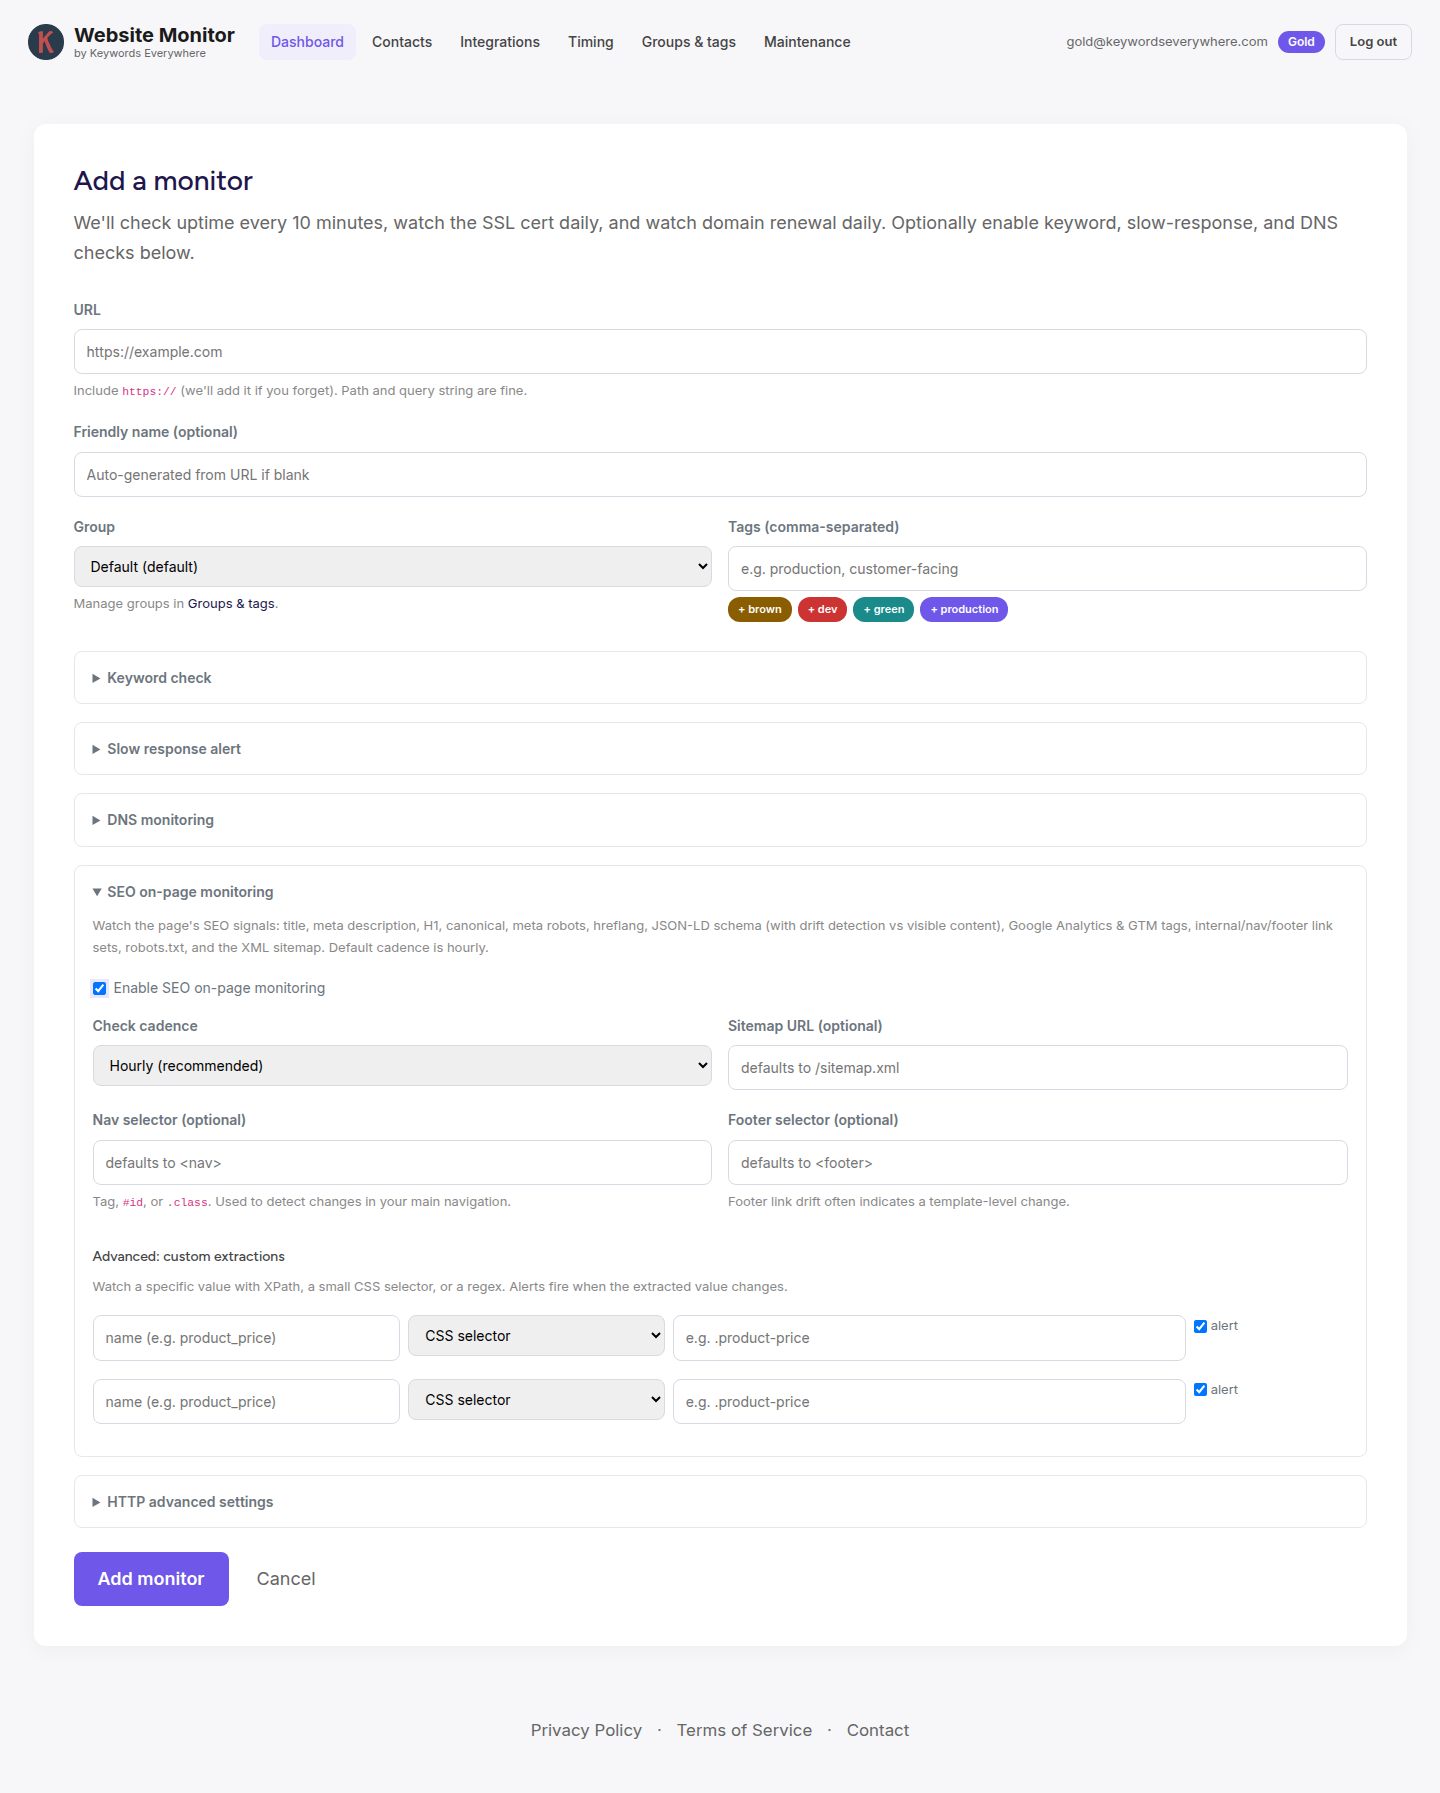
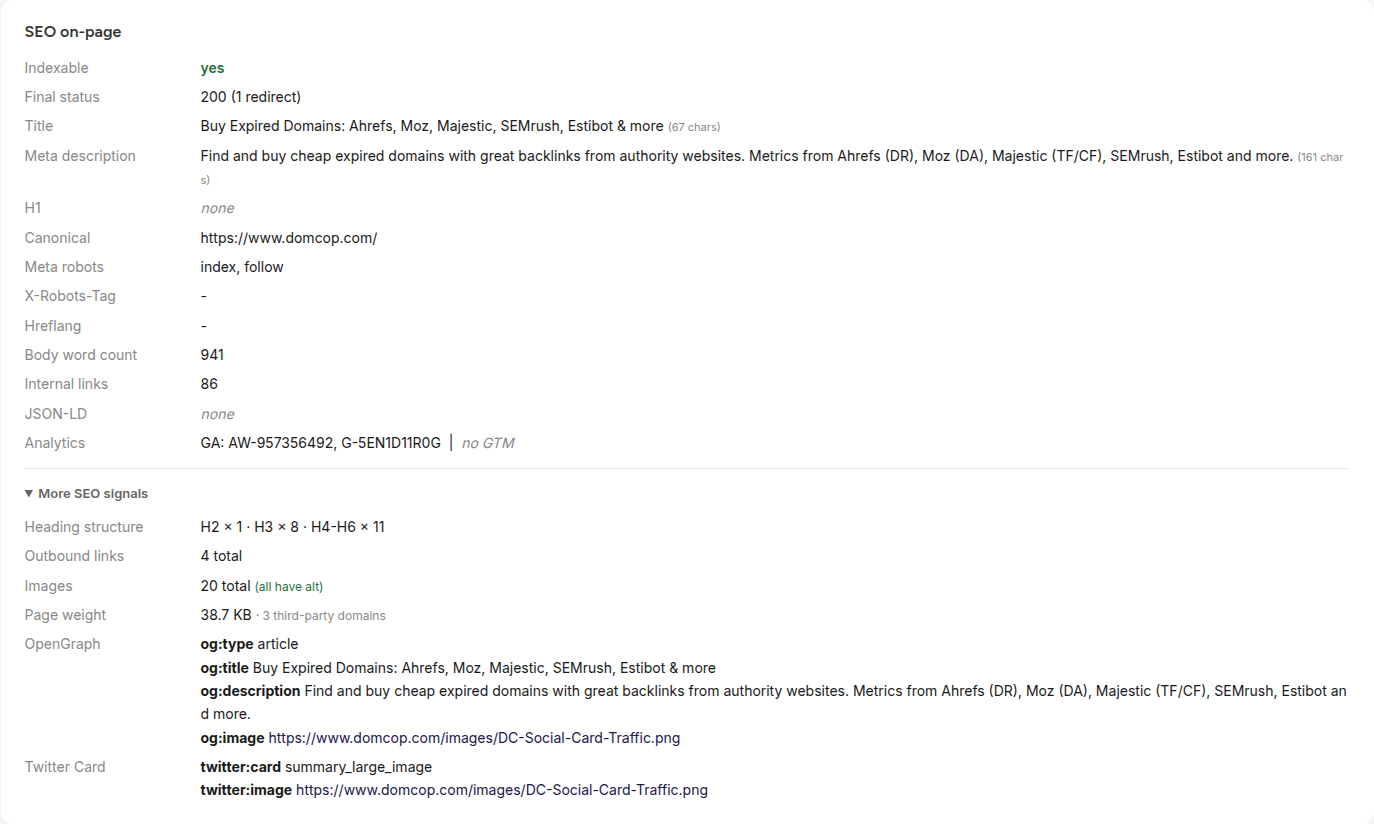
On every check we capture and diff a long list of signals. The most important is indexability: we read the meta robots tag, the X-Robots-Tag header, the canonical tag, and the redirect chain, then boil them down to one answer, can Google index this page right now. The day that flips, you hear about it.
We also track your title, meta description, H1 and full heading structure, internal and outbound links, image alt coverage, JSON-LD structured data (including drift detection, when your schema claims a price or availability that the visible page does not match), Google Analytics and Tag Manager IDs, other analytics and marketing pixels, OpenGraph and Twitter Card tags, page weight, and your robots.txt and XML sitemap. For anything we do not cover out of the box, add a custom extraction with an XPath, a CSS selector, a regex, an HTTP header, or a JSON path, and we alert when its value changes.
When a signal changes, the alert is the same clear email you get for downtime, and the monitor page keeps a running log of changes with the before and after side by side. robots.txt and the sitemap are checked once a day; the on-page signals follow your chosen cadence.
The monitor page
Click any monitor to open its detail page. It gathers everything we know about that site in one place.
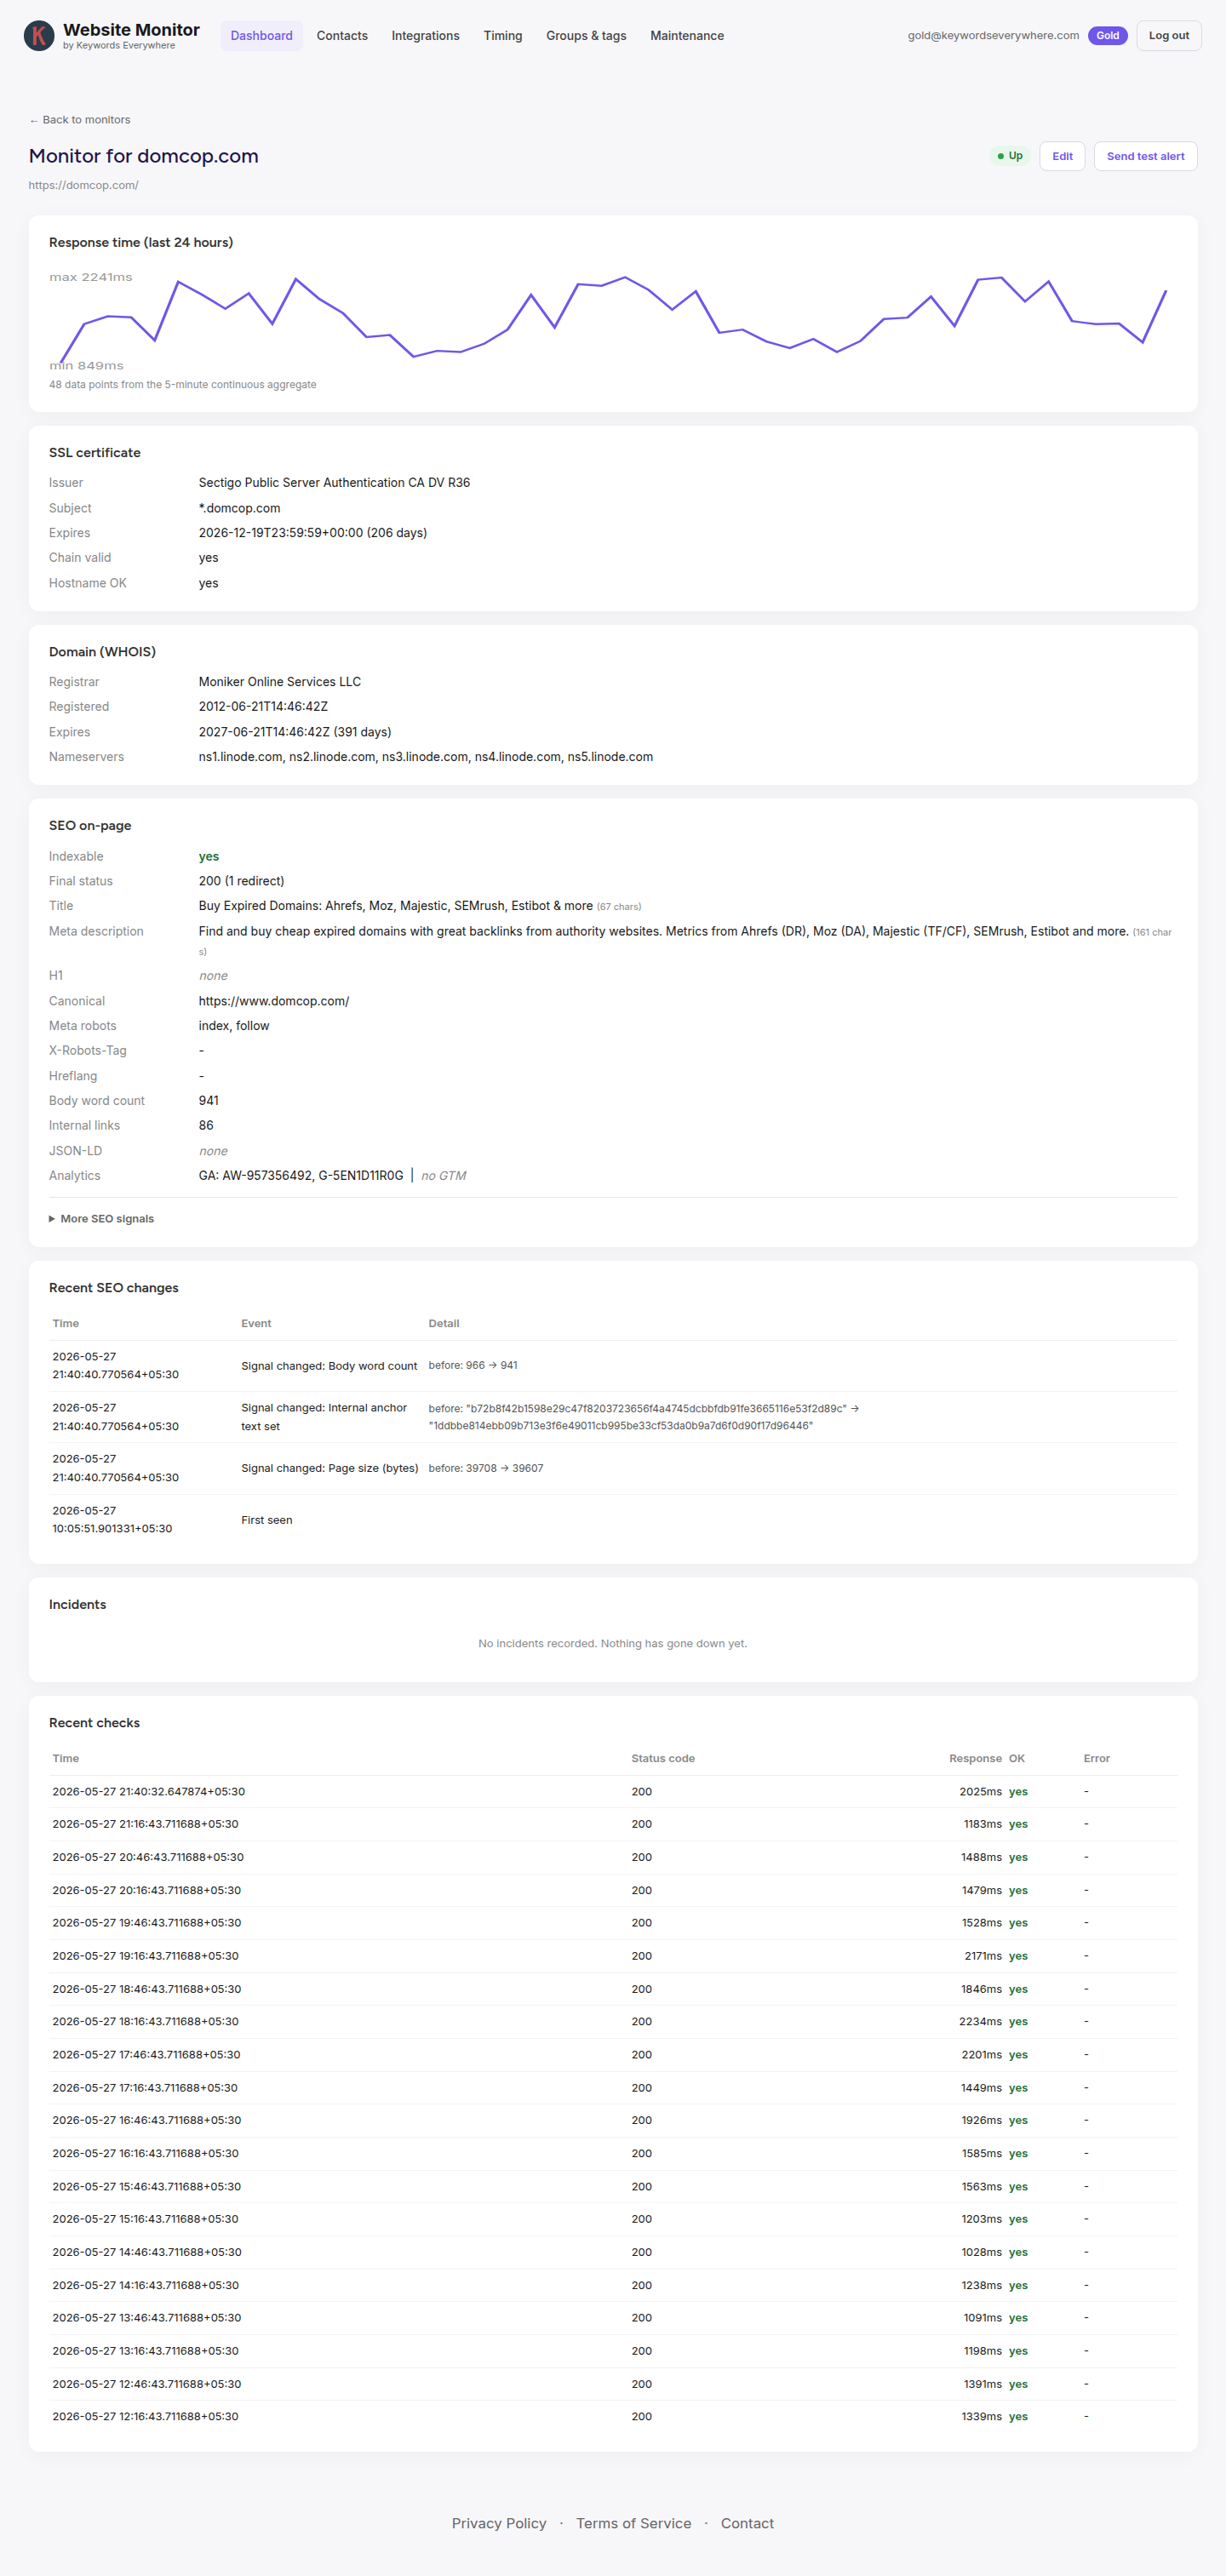
- Response time (last 24 hours): a chart of how fast the site responded on each check.
- SSL certificate and Domain (WHOIS): the current certificate and registration details, with expiry countdowns.
- SEO on-page: the current value of every SEO signal, with "More SEO signals" for the full set.
- Recent SEO changes: a dated log of what changed, with the previous and new values.
- Incidents: every downtime or threshold event, with its start, end, and duration.
- Recent checks: the raw check history, status code and response time per row.
Two buttons sit at the top. Send test alert fires a sample notification through all your channels so you can confirm delivery. When an incident is open, Acknowledge stops the repeat reminders without closing the incident (the worker still closes it on its own once the site recovers).
Editing & deleting
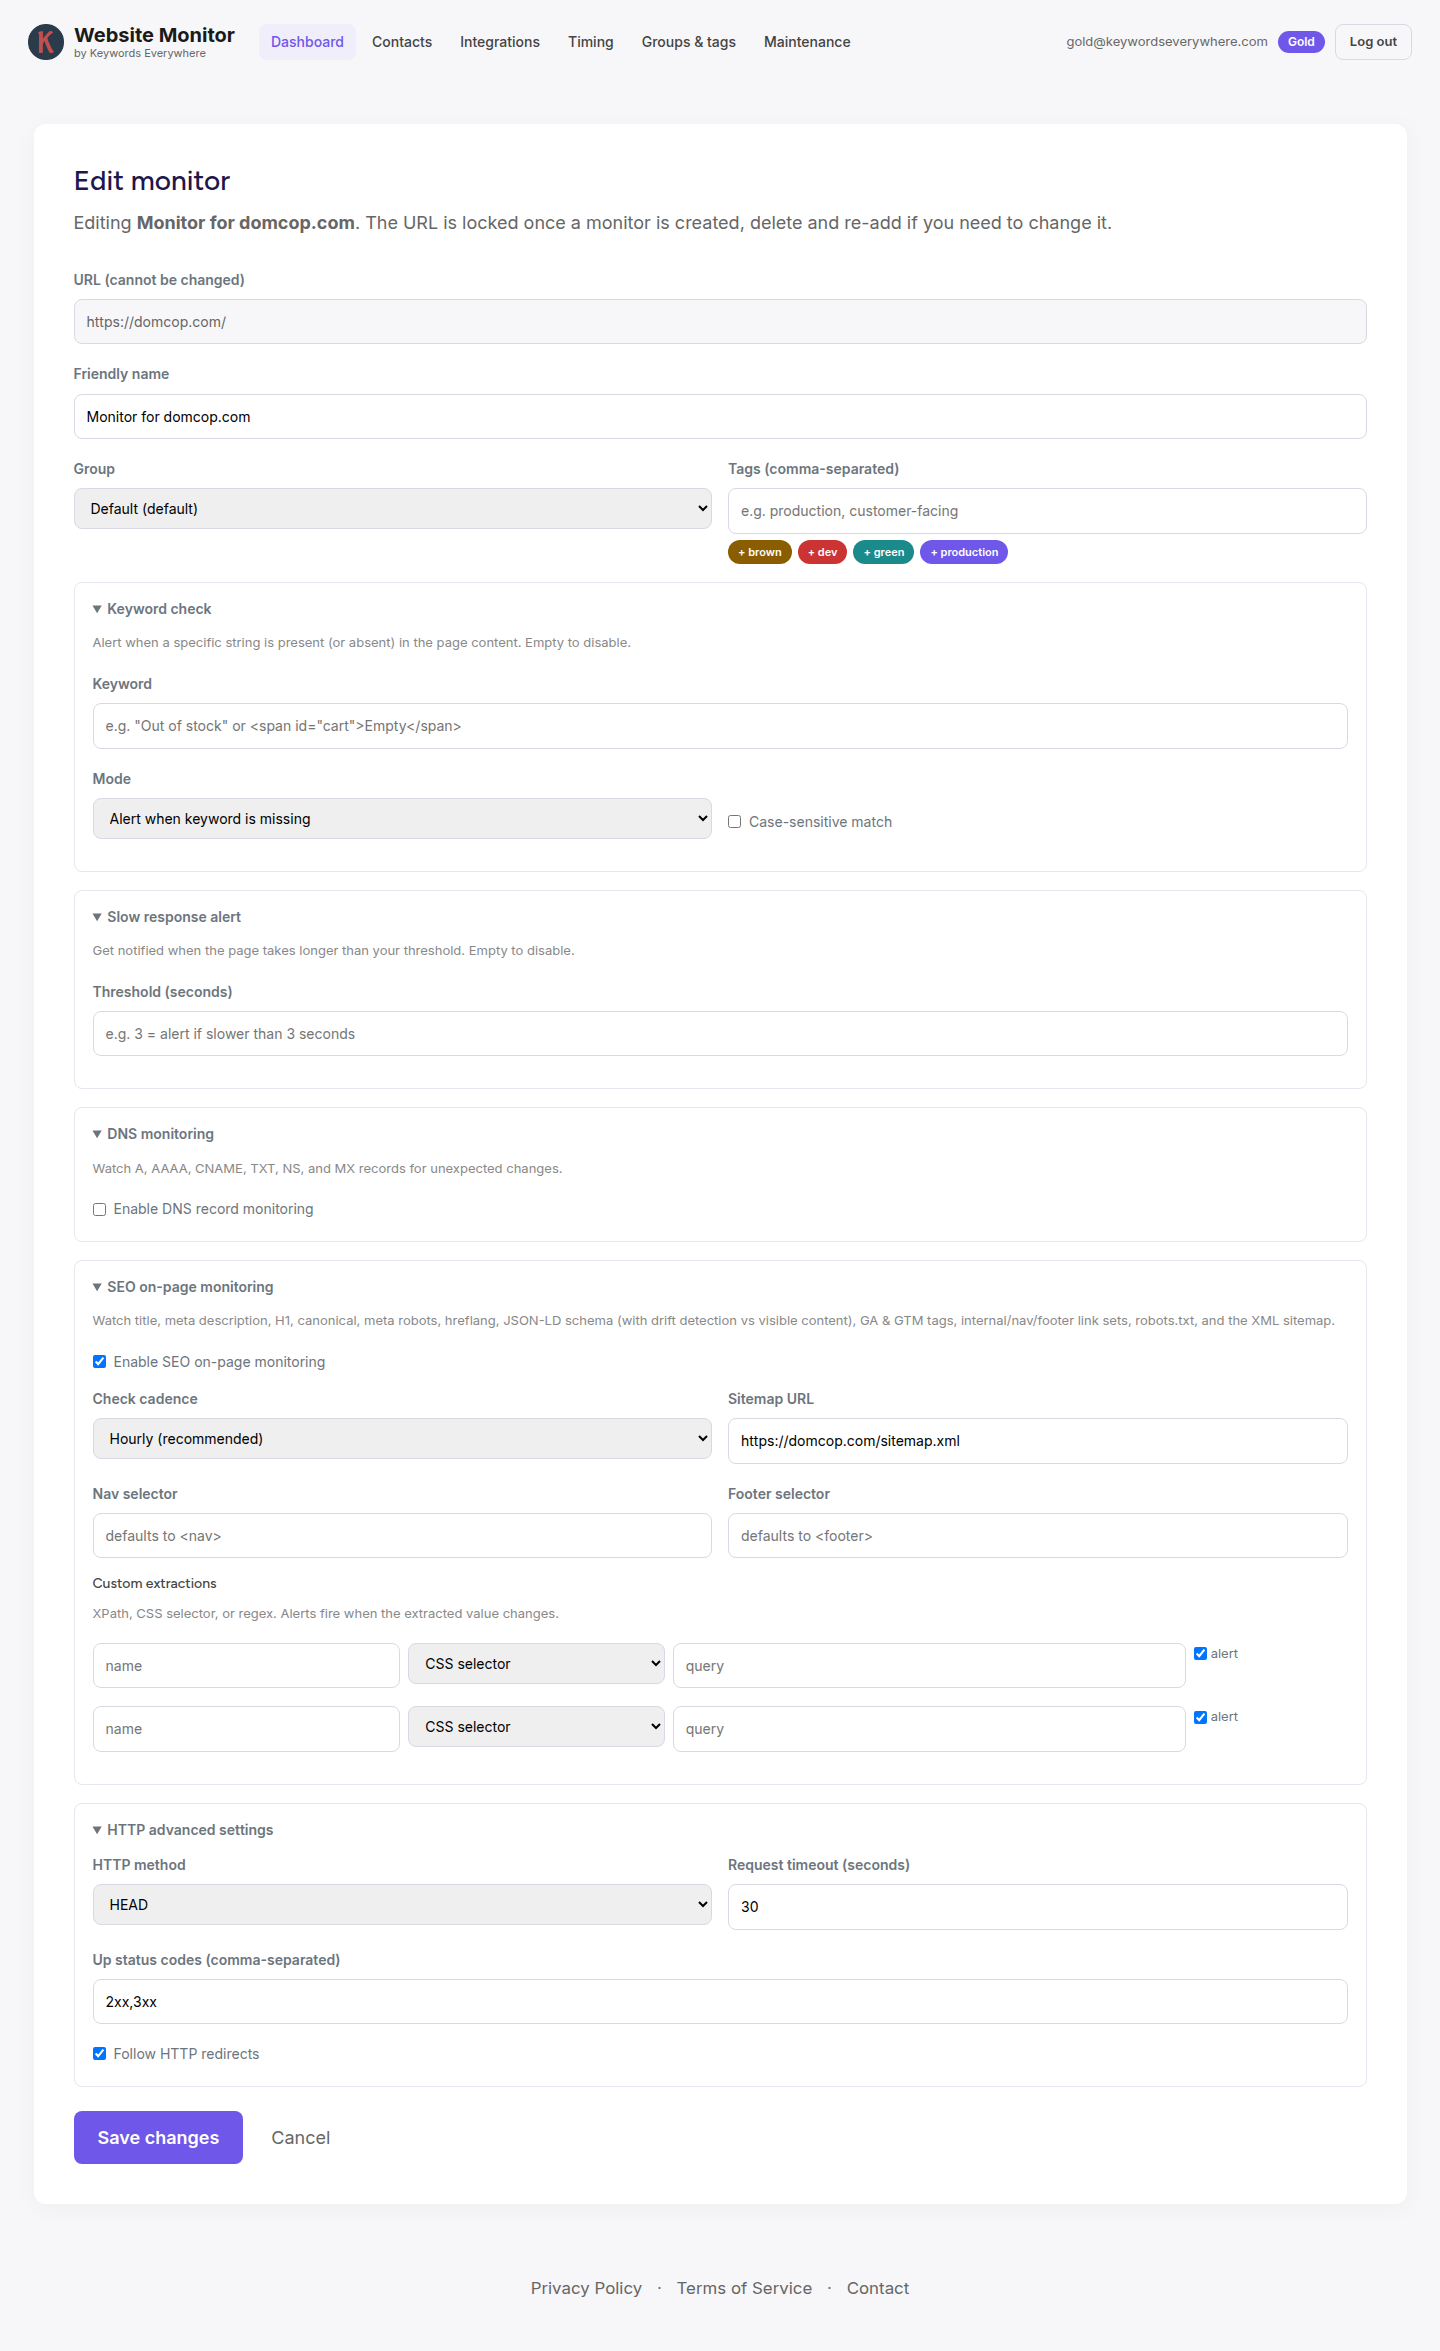
The edit page exposes every setting from the add form, so you can turn checks on or off, change the cadence, adjust thresholds, move the monitor to another group, or retag it at any time.
Alert contacts
Contacts are the email addresses that receive alerts for your workspace. Your Keywords Everywhere account email is added automatically as the first contact. You can add as many more as you like, teammates, an on-call address, a shared inbox, at no extra cost.
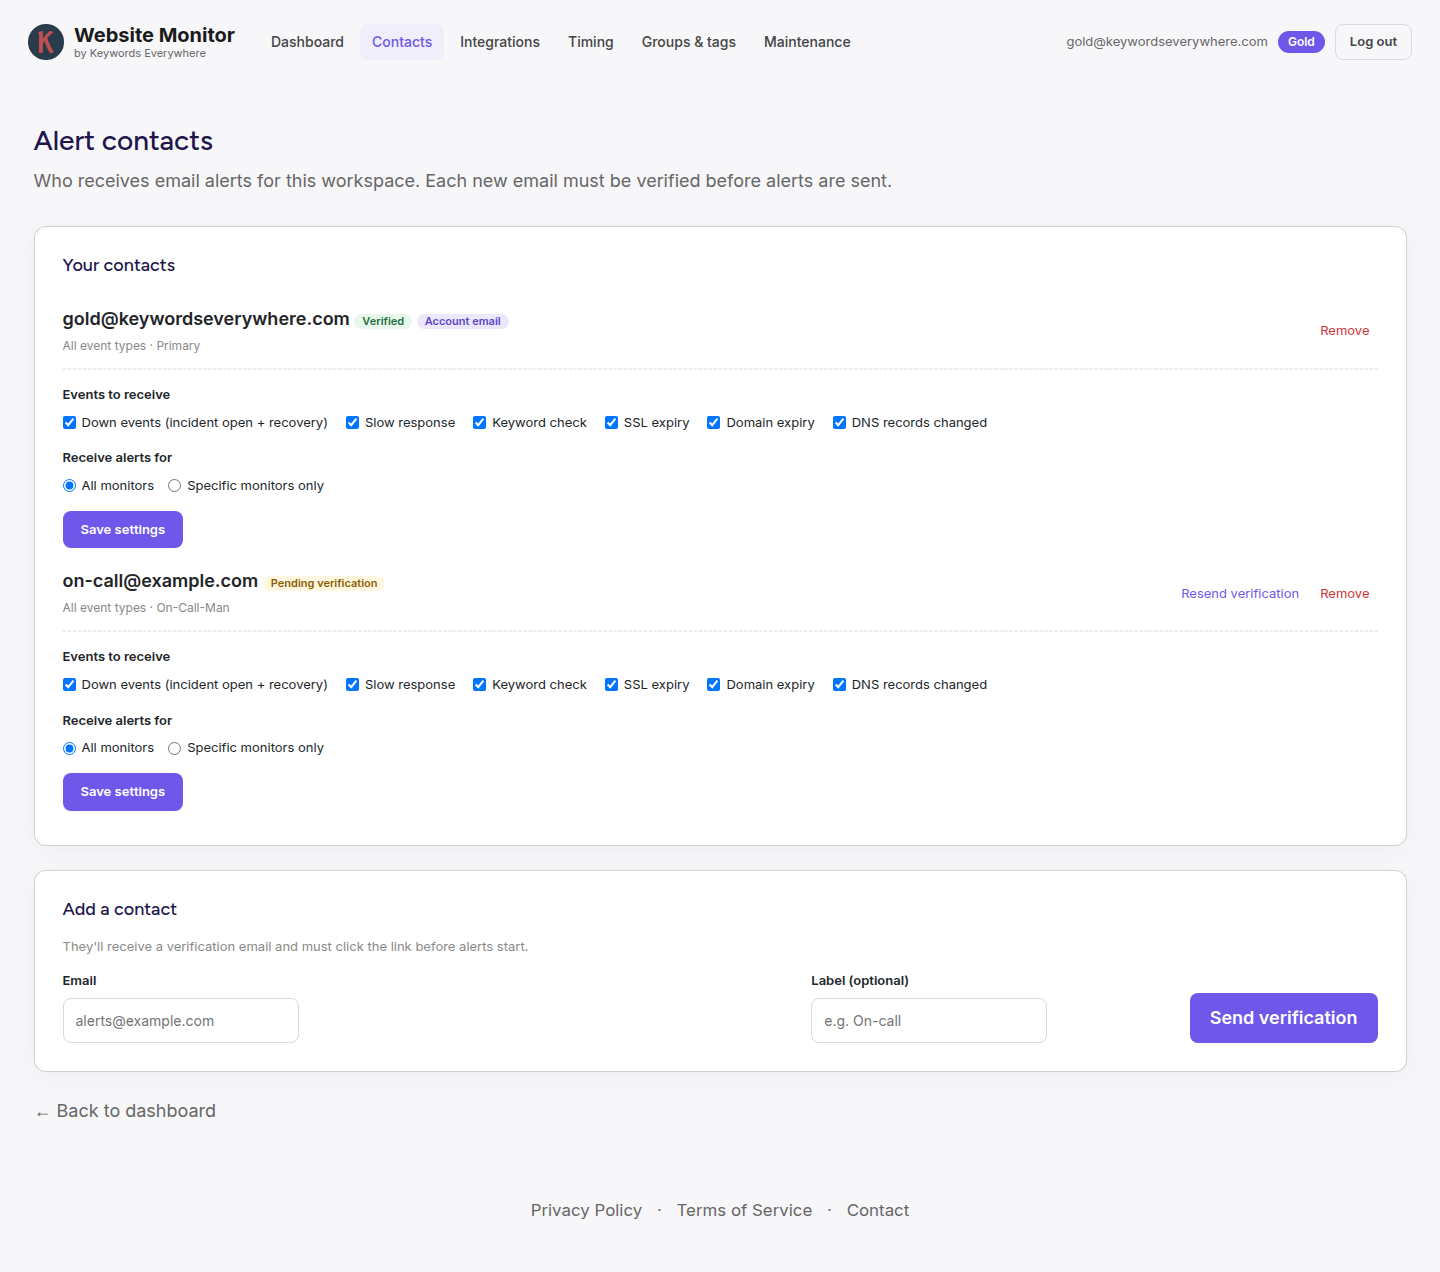
Every new email is sent a confirmation link and must verify before any alert is delivered to it. This is deliberate: it stops anyone from pointing a flood of alert emails at an address that never agreed to receive them. Until a contact clicks the link, they show as "Pending verification" and we hold their alerts.
For each contact you can choose which event types they receive (down events, slow response, keyword, SSL, domain, DNS) and whether they get alerts for all monitors or only specific ones. That lets you send SSL and domain warnings to one person and downtime to another.
Slack & webhooks
Beyond email and browser push, you can route alerts to Slack or to your own HTTP endpoint. Both are free and on every plan.
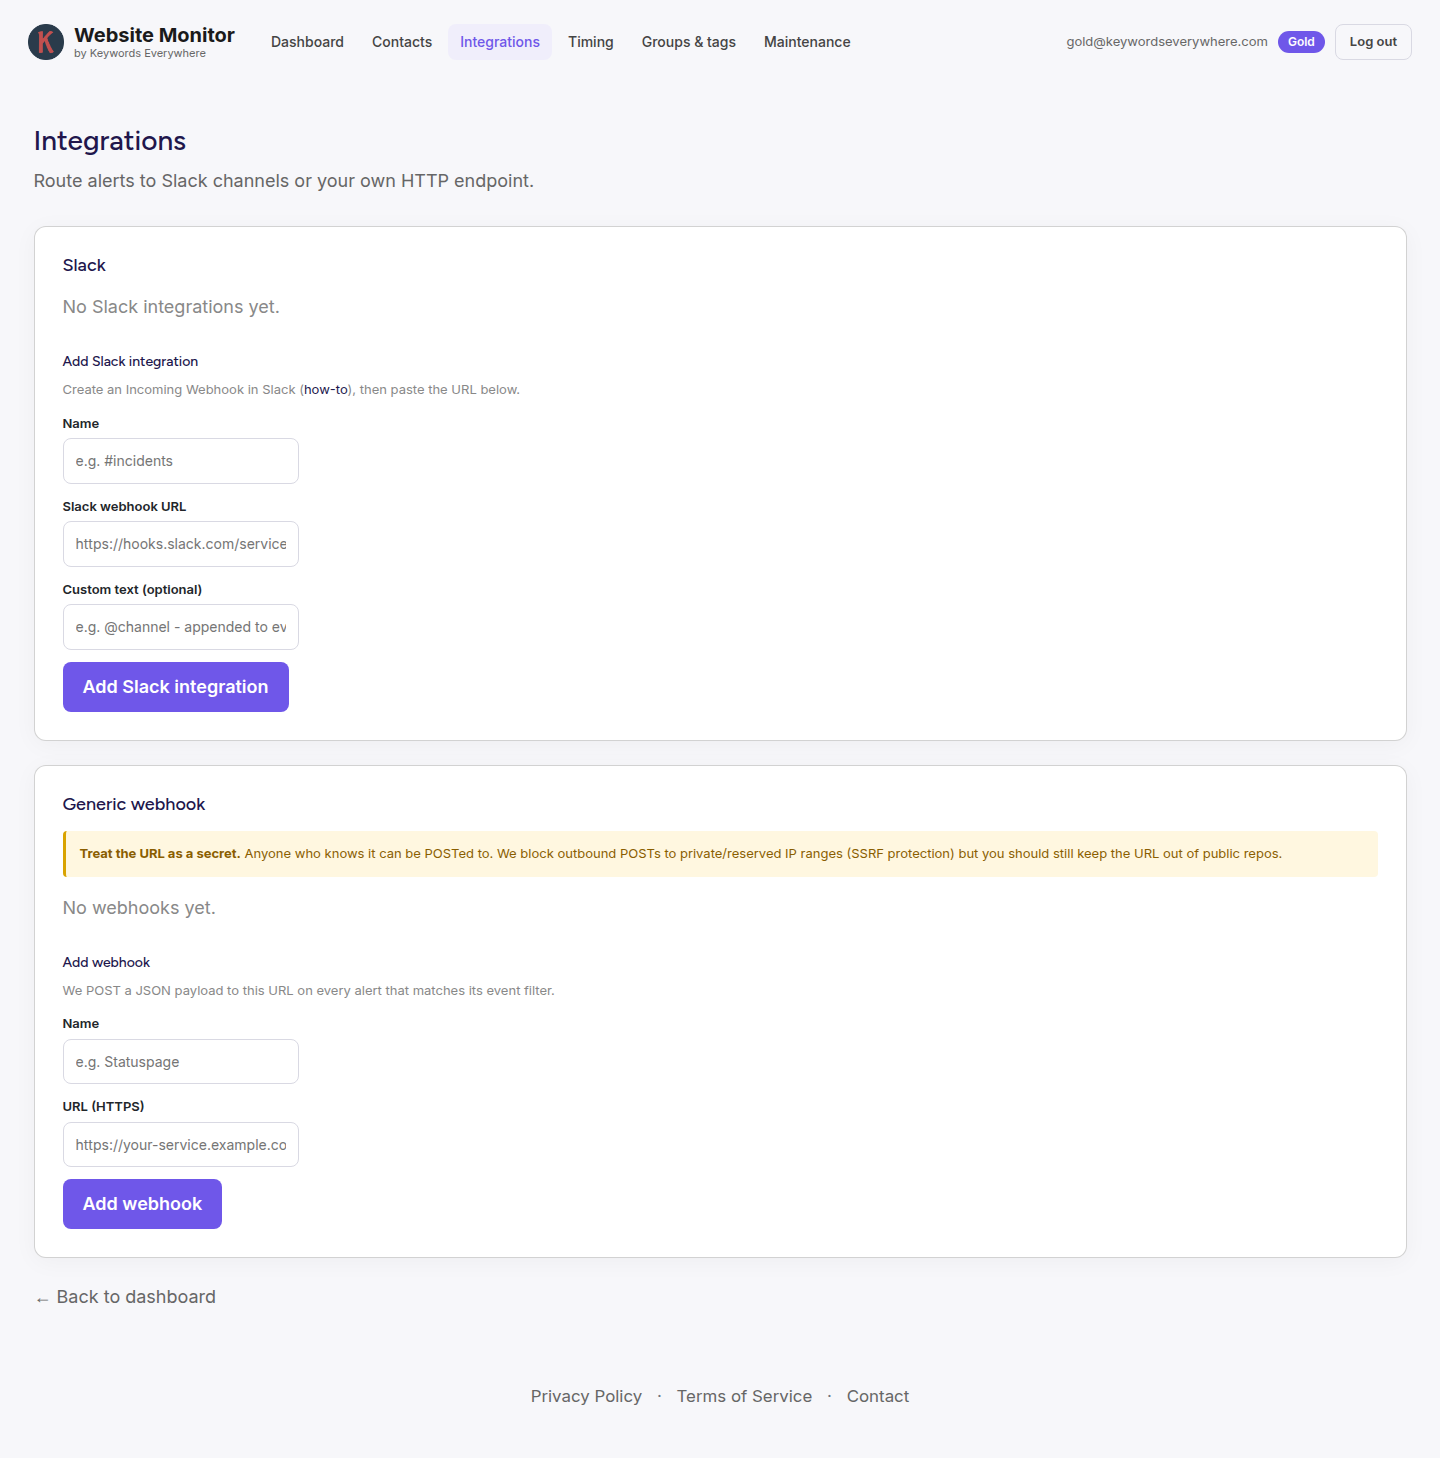
- Slack: create an Incoming Webhook in your Slack workspace, paste the URL, and name it after the channel. You can append custom text (like an
@channelmention) to every message. - Generic webhook: we POST a JSON payload to your HTTPS endpoint on every matching alert, handy for a status page or your own automation.
Notification timing
Two controls shape when alerts arrive, set per channel, with optional per-monitor overrides.
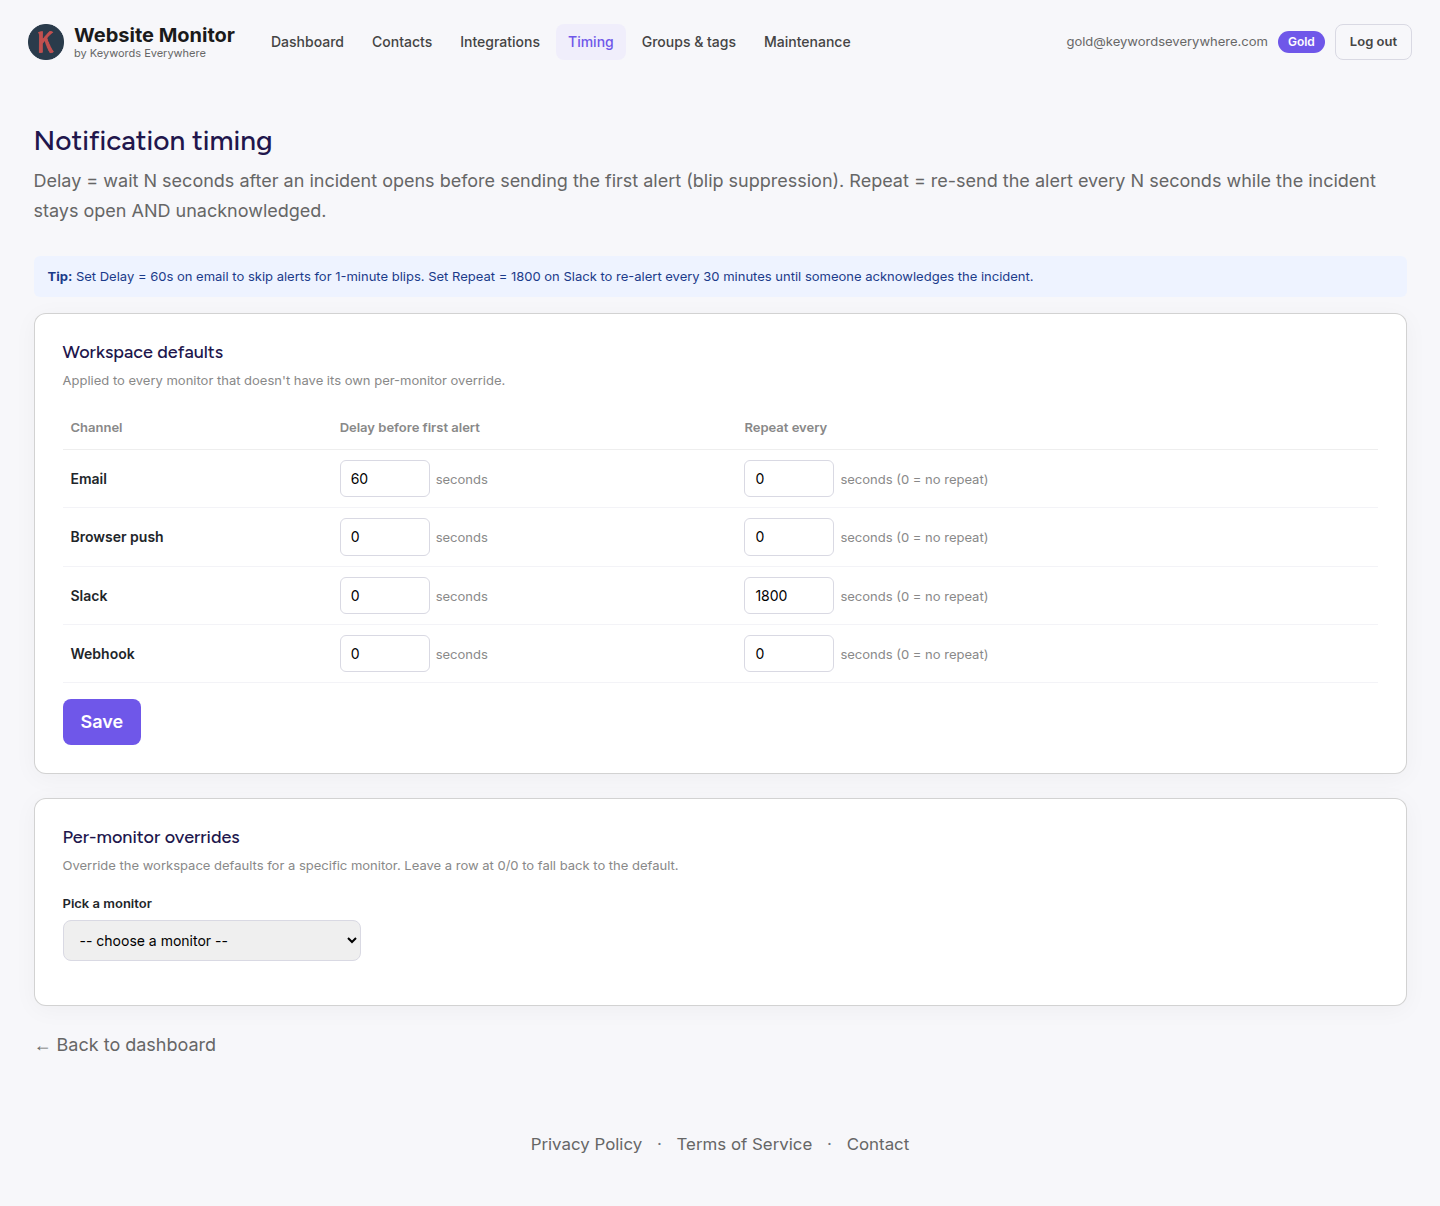
- Delay: wait N seconds after an incident opens before sending the first alert. Set it to 60 seconds on email to skip alerts for one-minute blips entirely.
- Repeat: re-send the alert every N seconds while the incident stays open and unacknowledged. Set it to 1800 on Slack to nag every 30 minutes until someone acknowledges.
Set workspace defaults that apply to every monitor, then override them for a specific monitor when one site deserves different handling.
What alerts you get
We only contact you when something actually changes. A healthy site is a silent site. Here is the full list of what triggers an alert:
- Down and recovered: after two consecutive failures, and again when the site comes back.
- Slow response: when a response crosses your threshold.
- Keyword: when your expected text disappears, or unexpected text appears.
- SSL: at 30, 14, 7, and 1 day before expiry.
- Domain: at 60, 30, 14, and 7 days before expiry.
- DNS: when a watched record changes.
- SEO: when indexability flips or a watched on-page signal, robots.txt, or sitemap changes.
Email goes out over a dedicated sending IP so it reaches the inbox, not spam. Browser push is optional and free, and works on any HTTPS page once you allow notifications. Add Slack and webhooks on top, and tune everything per contact, per channel, and per monitor as shown above.
Groups & tags
Two ways to keep a long list manageable. Groups are buckets: each monitor belongs to exactly one, and the dashboard can collapse and filter by them. Tags are free-form labels: a monitor can have many, each with a color, and you filter the dashboard by clicking a tag chip.
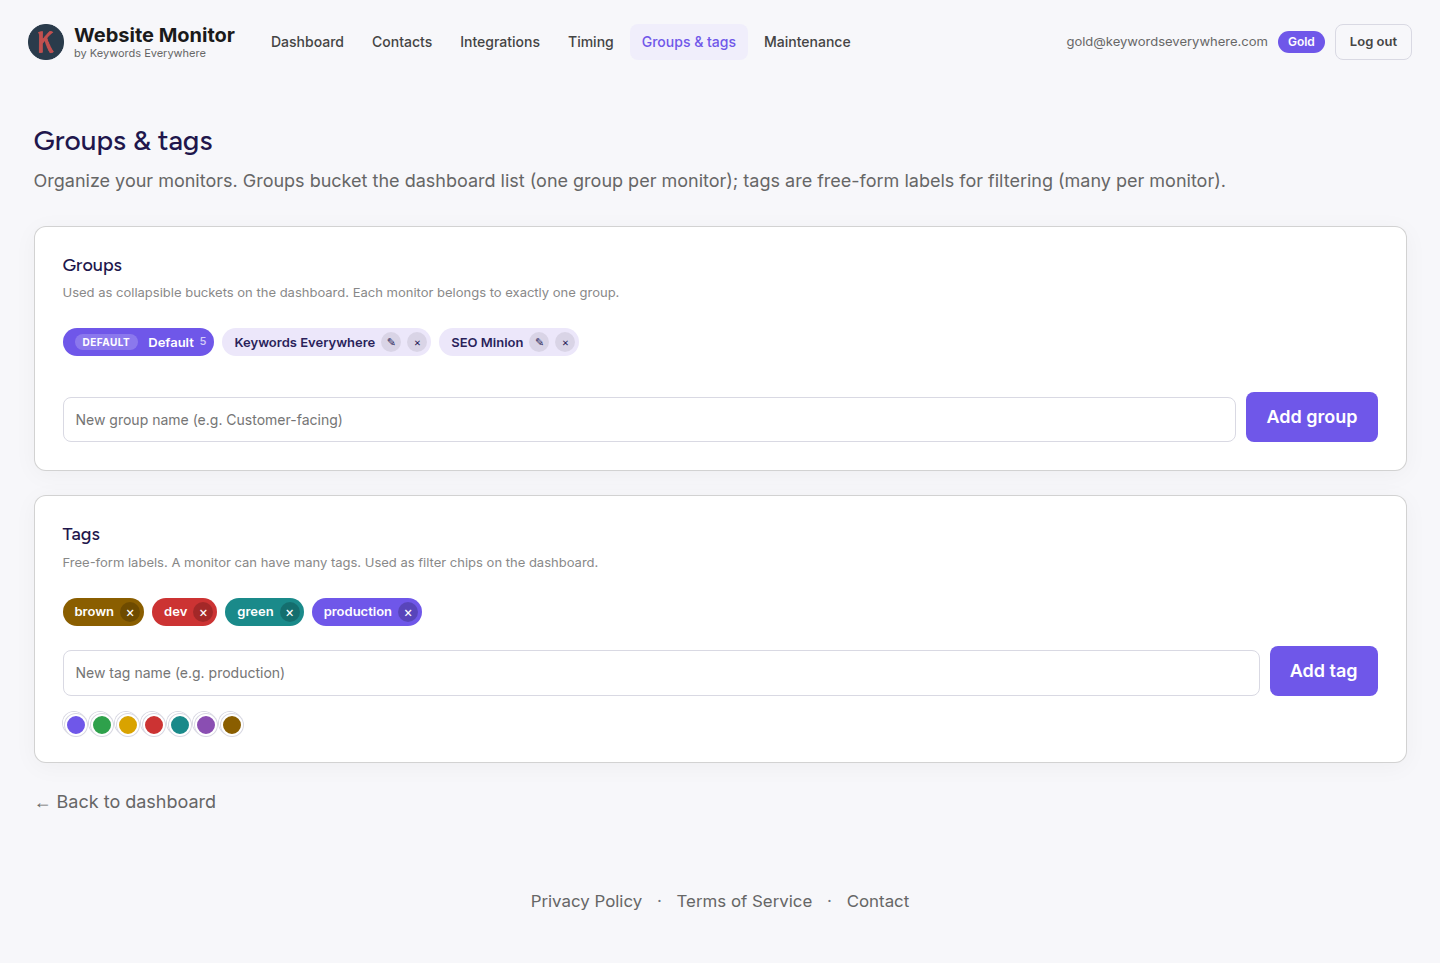
A typical setup is a group per client or per site, with tags like production, customer-facing, or landing-page cutting across them. You can create groups and tags here, or add a tag on the fly while adding a monitor.
Maintenance windows
Planning a deploy or some downtime? Schedule a maintenance window and we suppress alert delivery during it. We keep checking the whole time, so your history and charts stay complete, we just hold the notifications back so a planned outage does not page anyone.
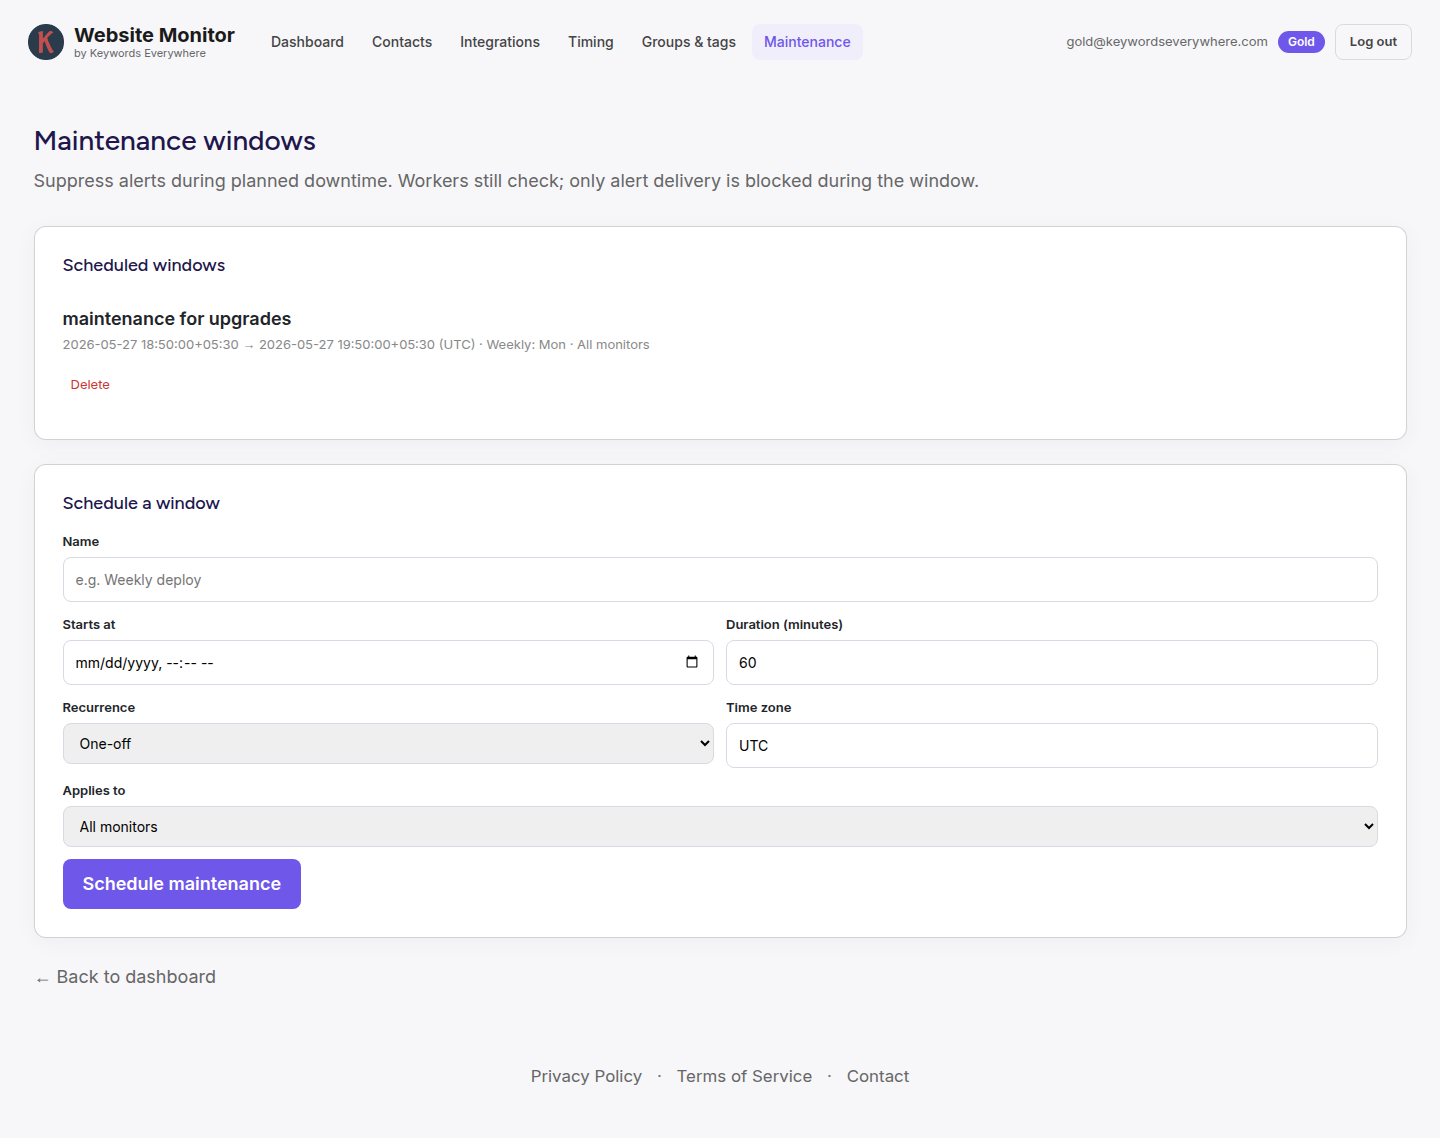
Set a start time, a duration, and a recurrence (one-off, daily, or weekly on a chosen day) in your time zone. A window can cover all monitors or only specific ones, so a single site's deploy does not silence the rest.
Plans & limits
Every plan includes every check and every alert channel. What changes between tiers is how many monitors you can run and how long we keep your check history. Your tier comes straight from your Keywords Everywhere subscription.
- Free: 50 monitors, 1 month of history.
- Bronze: 100 monitors, 2 months.
- Silver: 200 monitors, 4 months.
- Gold: 500 monitors, 8 months.
- Platinum: 1,000 monitors, 1 year.
To raise your limits, upgrade in Keywords Everywhere and log in again. That is the whole story: no separate billing, no feature paywalls, no per-seat charge for contacts.